Web App
DataVerse
Turn data into clarity.
- Status
- In Development
- Year
- 2026
- Platform
- Web
 In Development
Overview
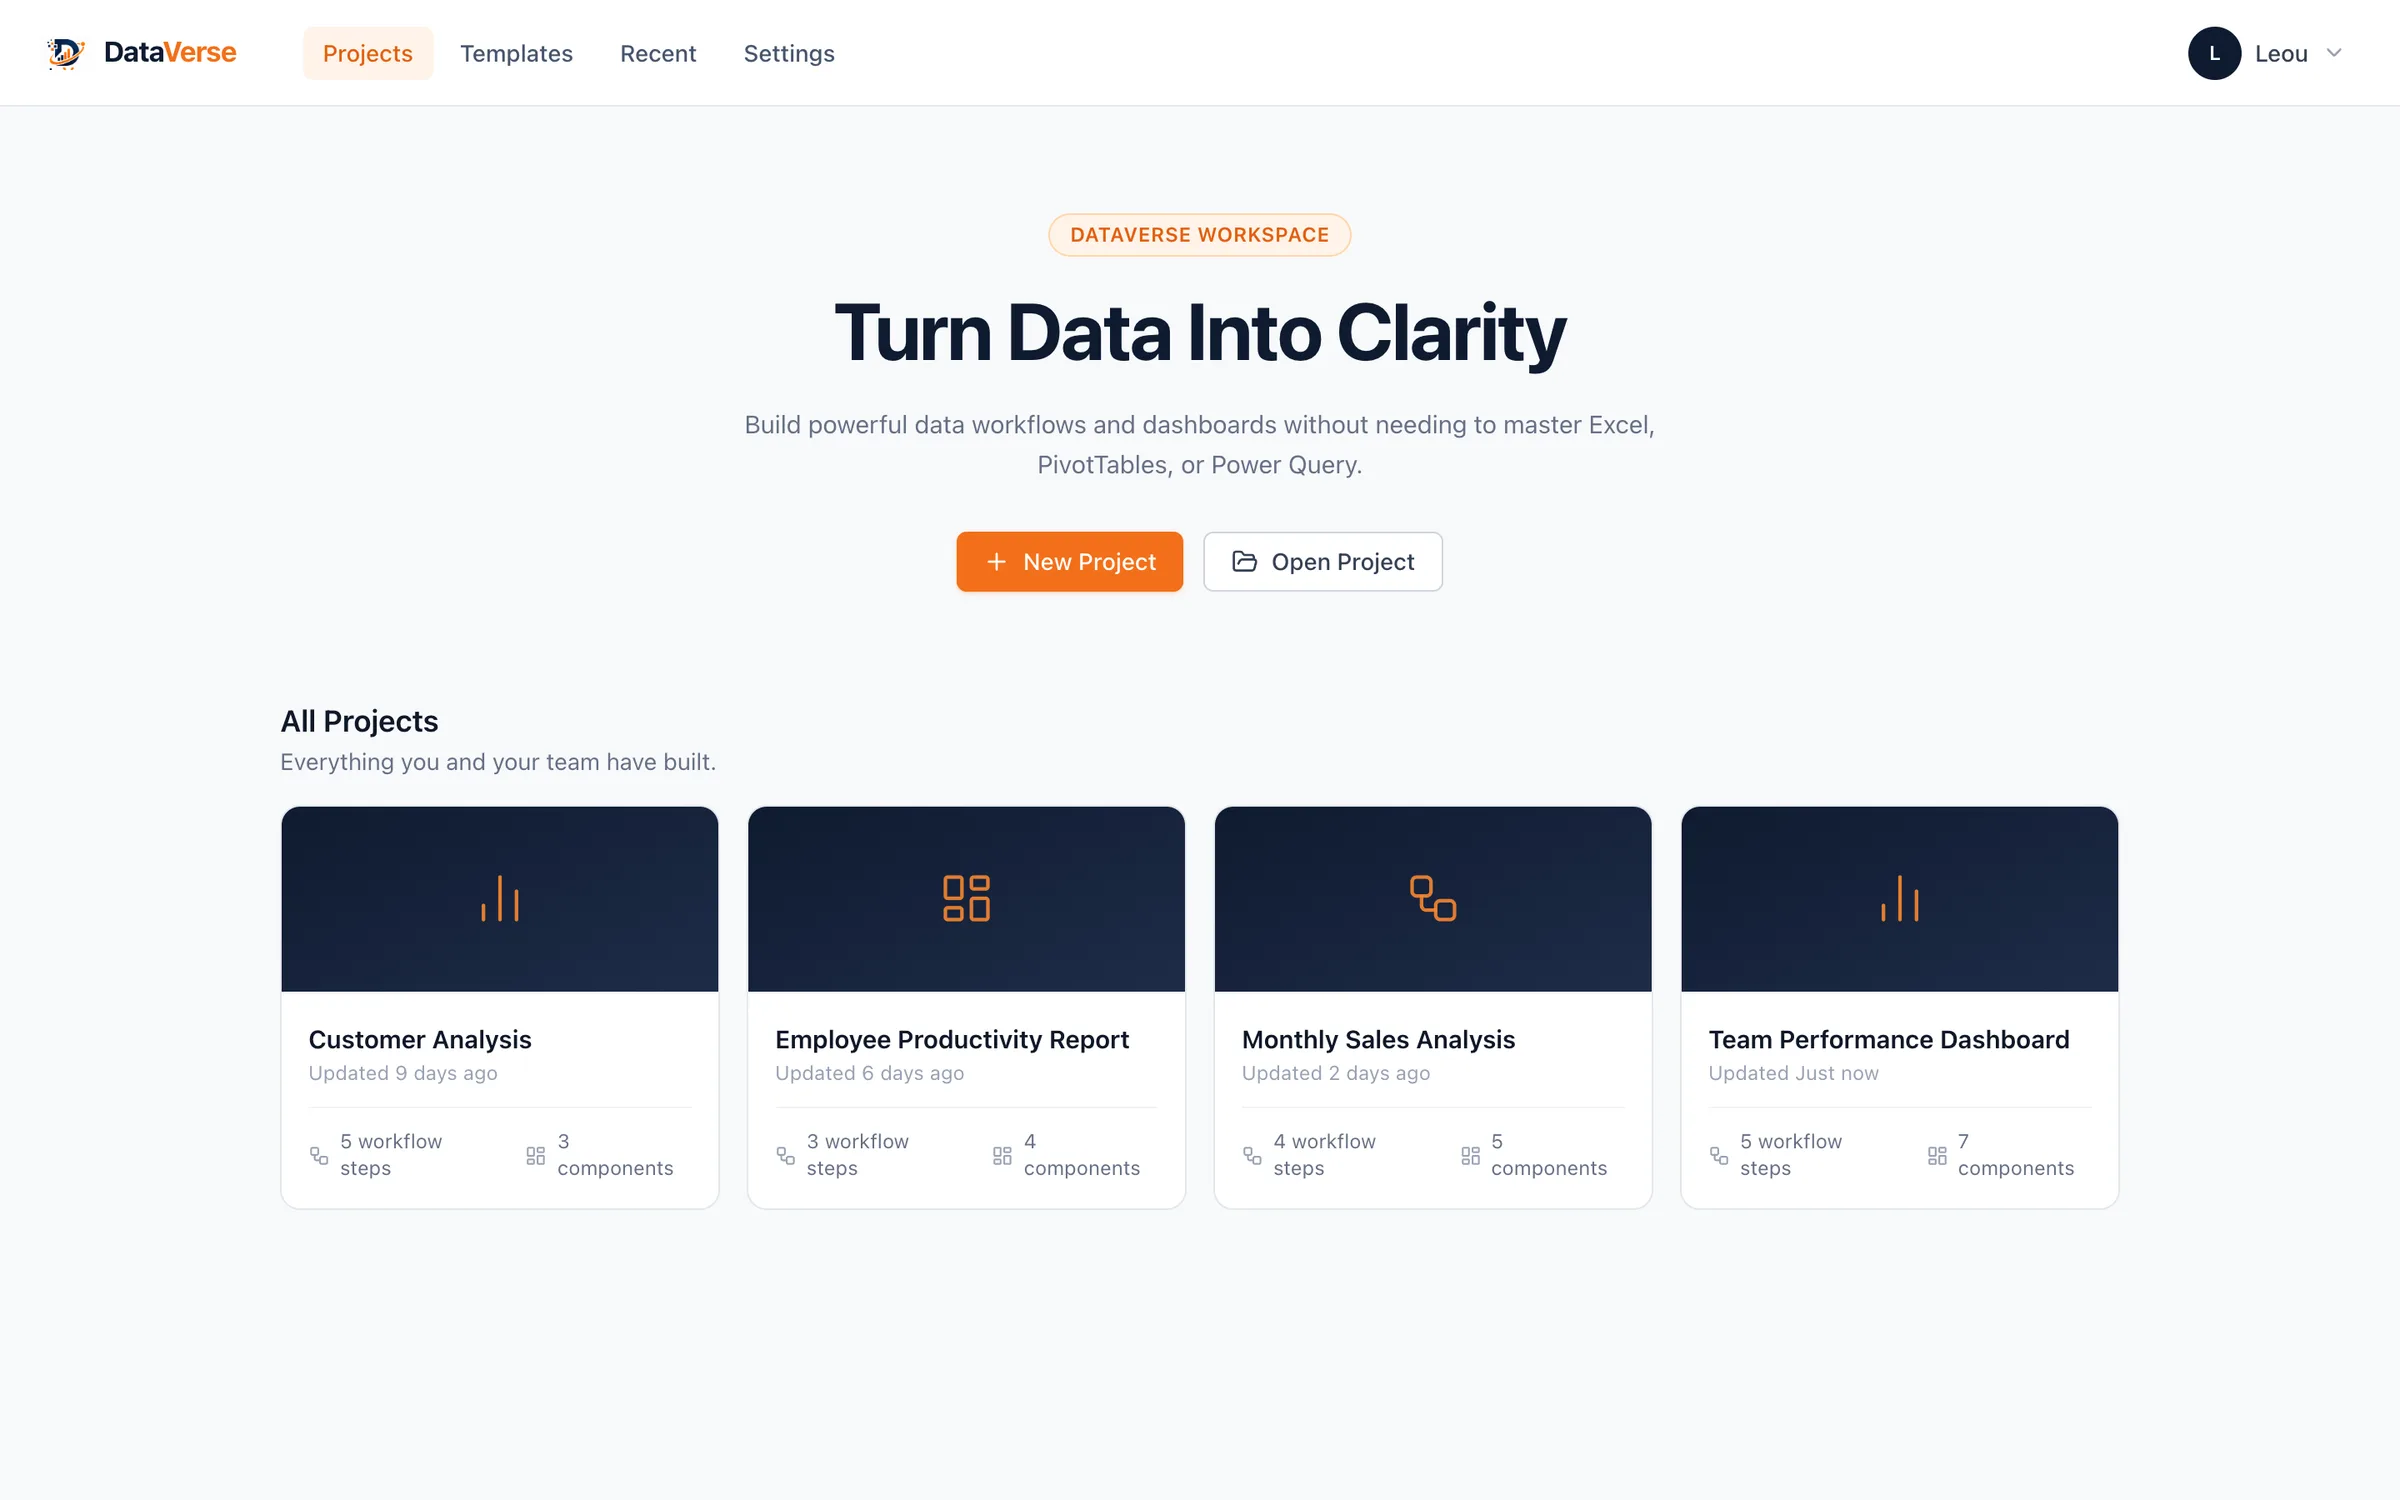
A data analytics platform for building data workflows and dashboards without needing to master Excel, PivotTables, or Power Query — simplifying work normally spread across spreadsheets and data transformation tools.
- Problem
- Everyday analysis is spread across spreadsheets, pivot tables, Power Query, and separate dashboard tools — powerful, but fragmented and hard to learn.
- Solution
- DataVerse brings transformation, analysis, and visualization into one visual workflow — no formulas or Power Query required.
- My Role
- Concept, product design, and development.
Features
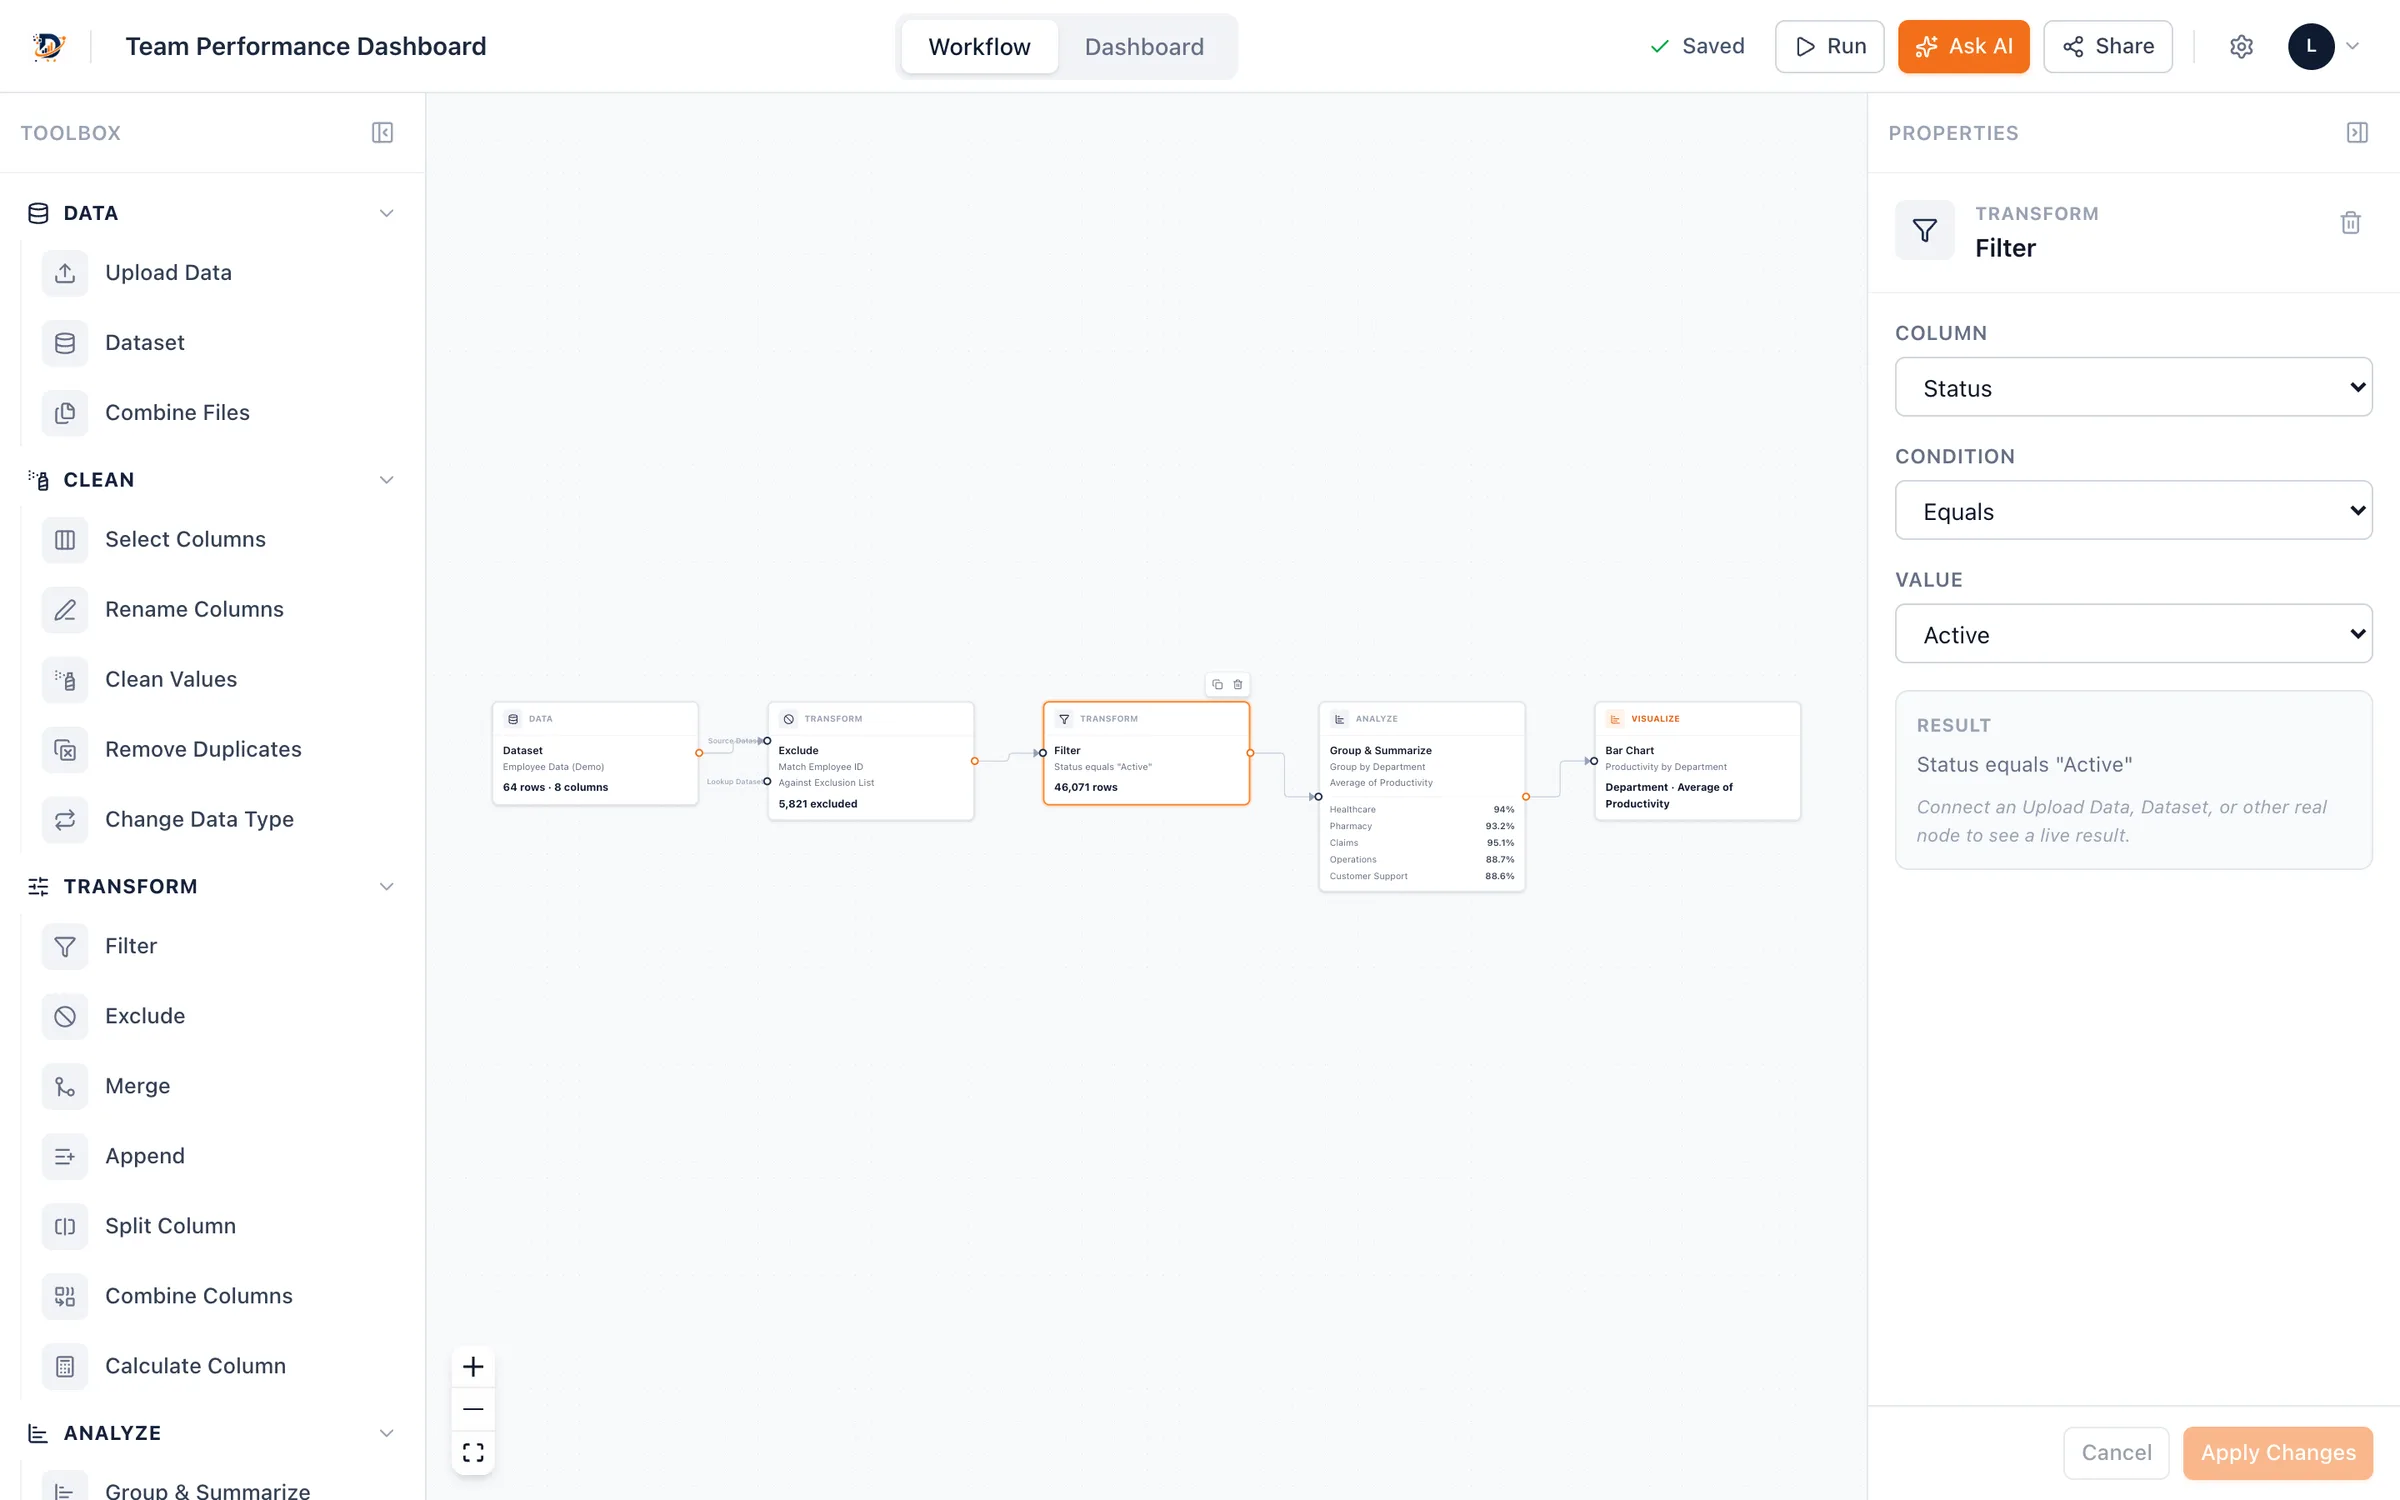
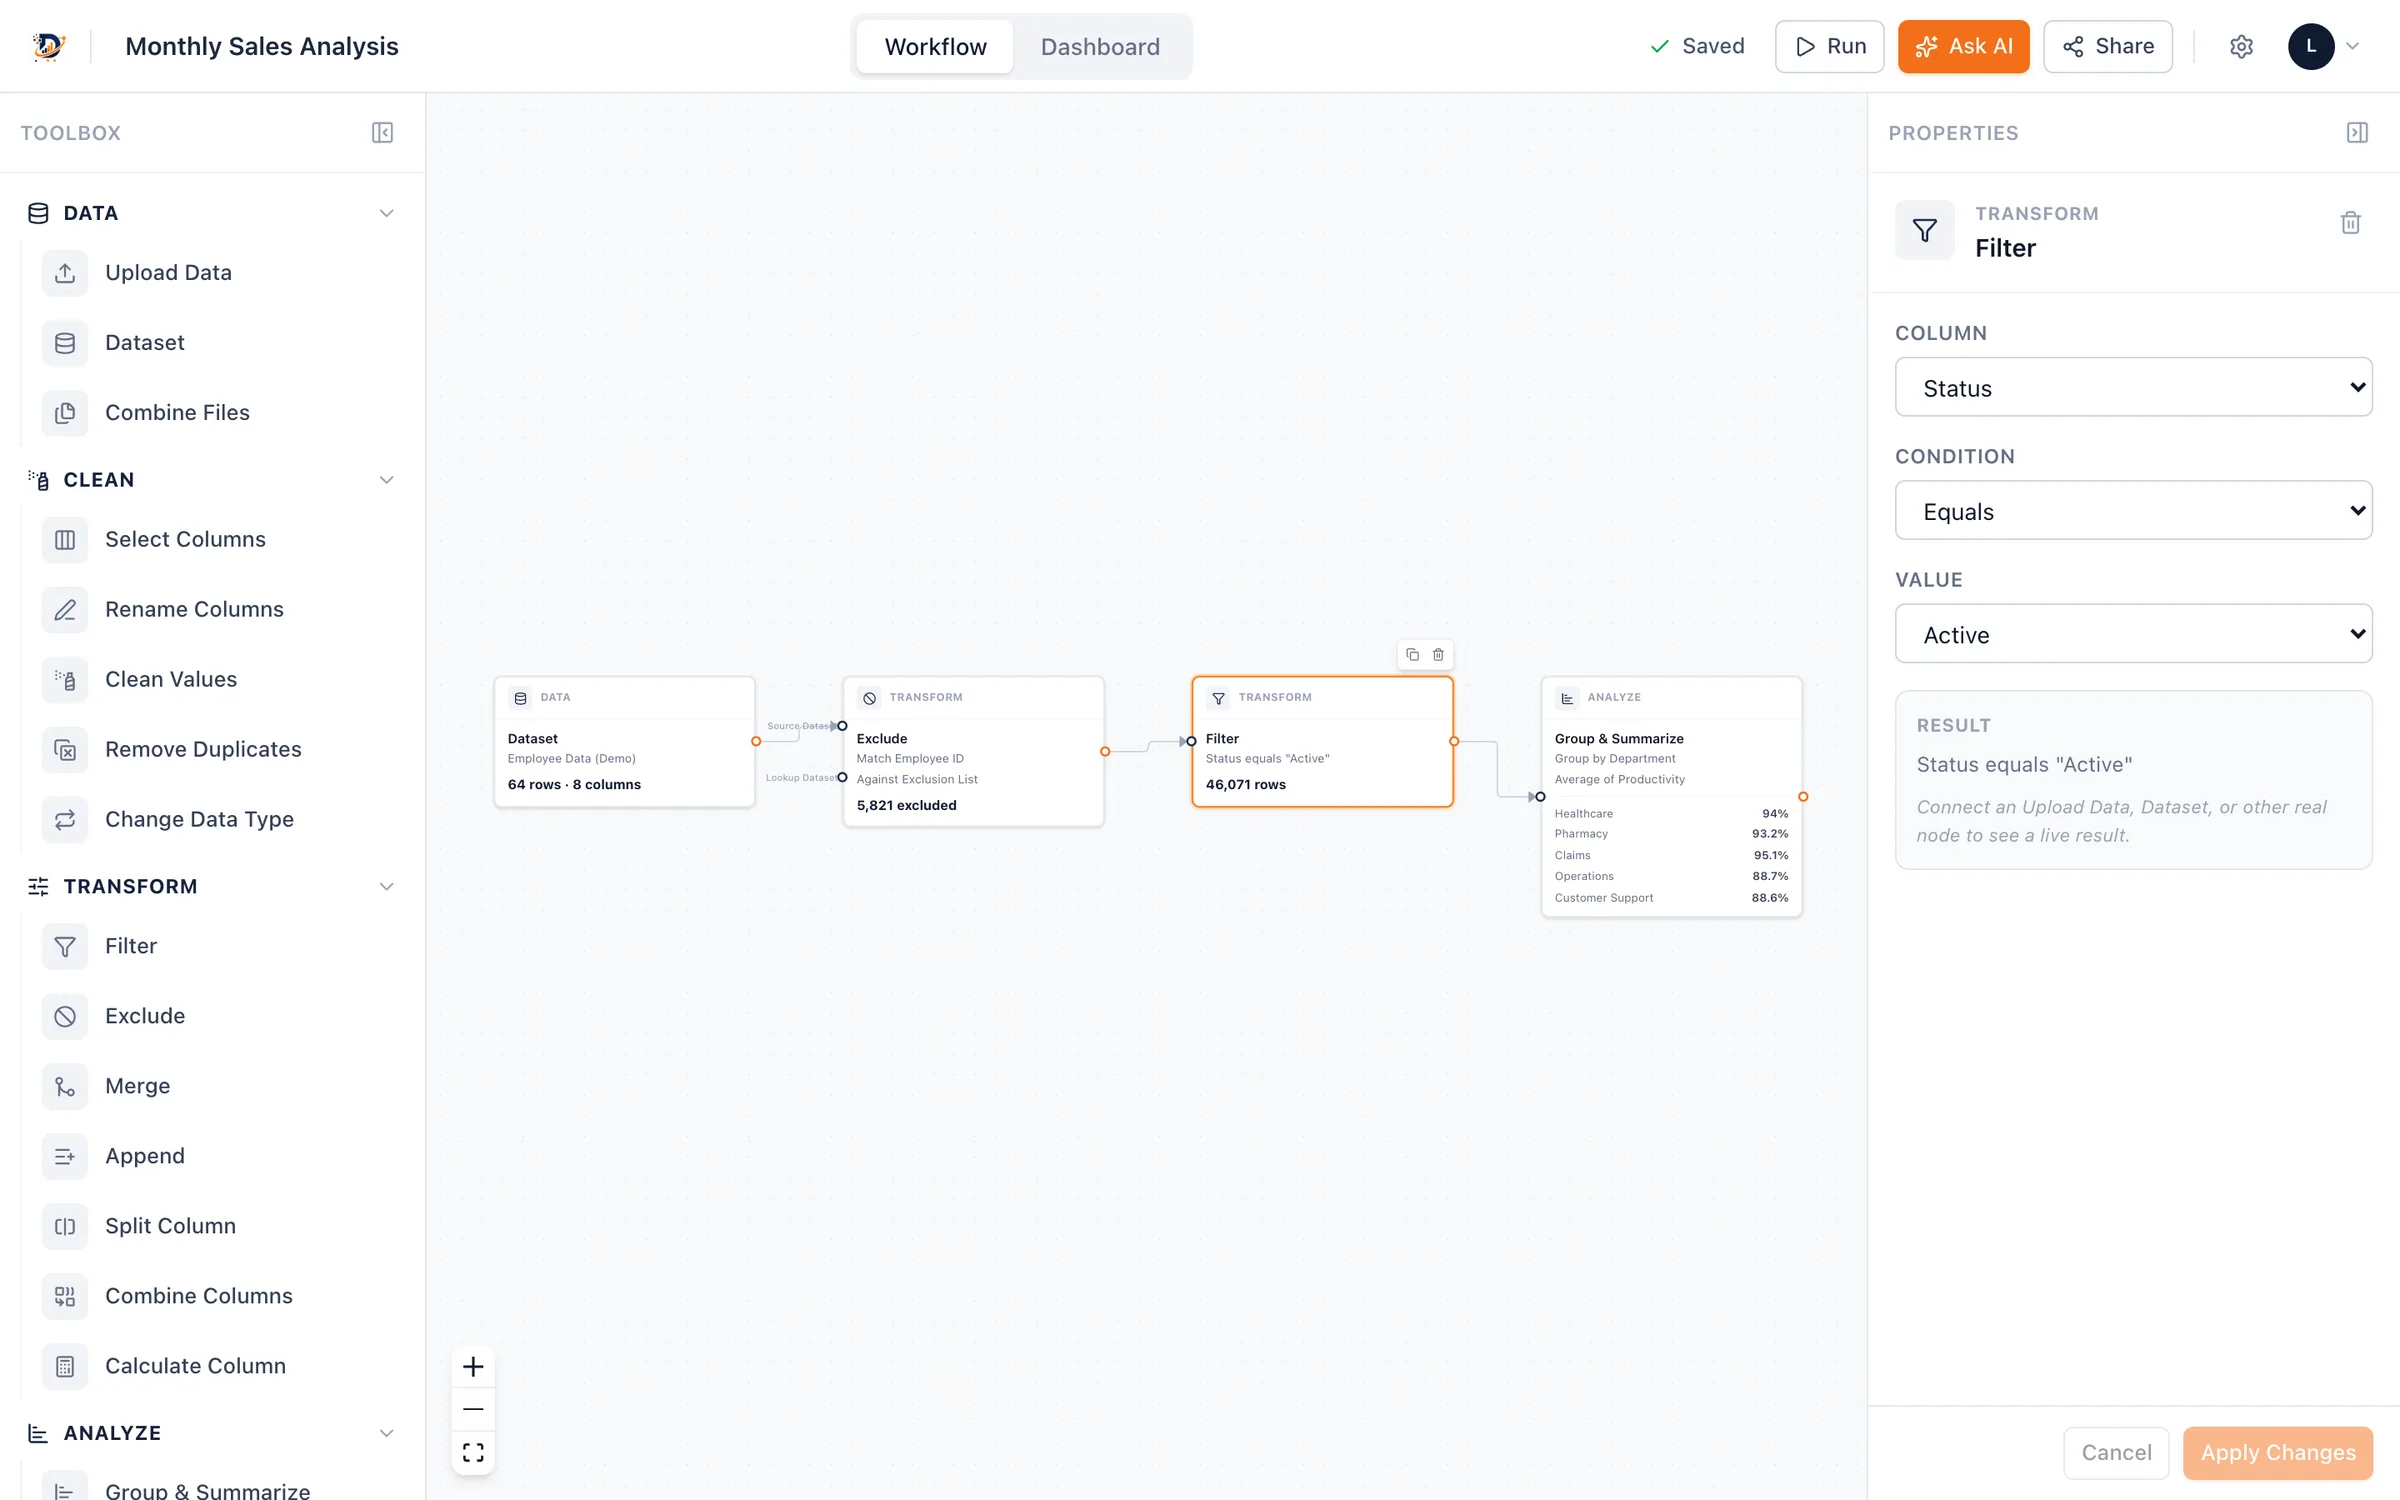
Visual workflows
Start from CSV or Excel files and chain steps on a canvas — each one shows its result.
Clean & transform
Select, rename, clean, de-duplicate, filter, exclude, merge, and append.
Group, pivot & calculate
Summarize and pivot data, with calculated columns and fields.
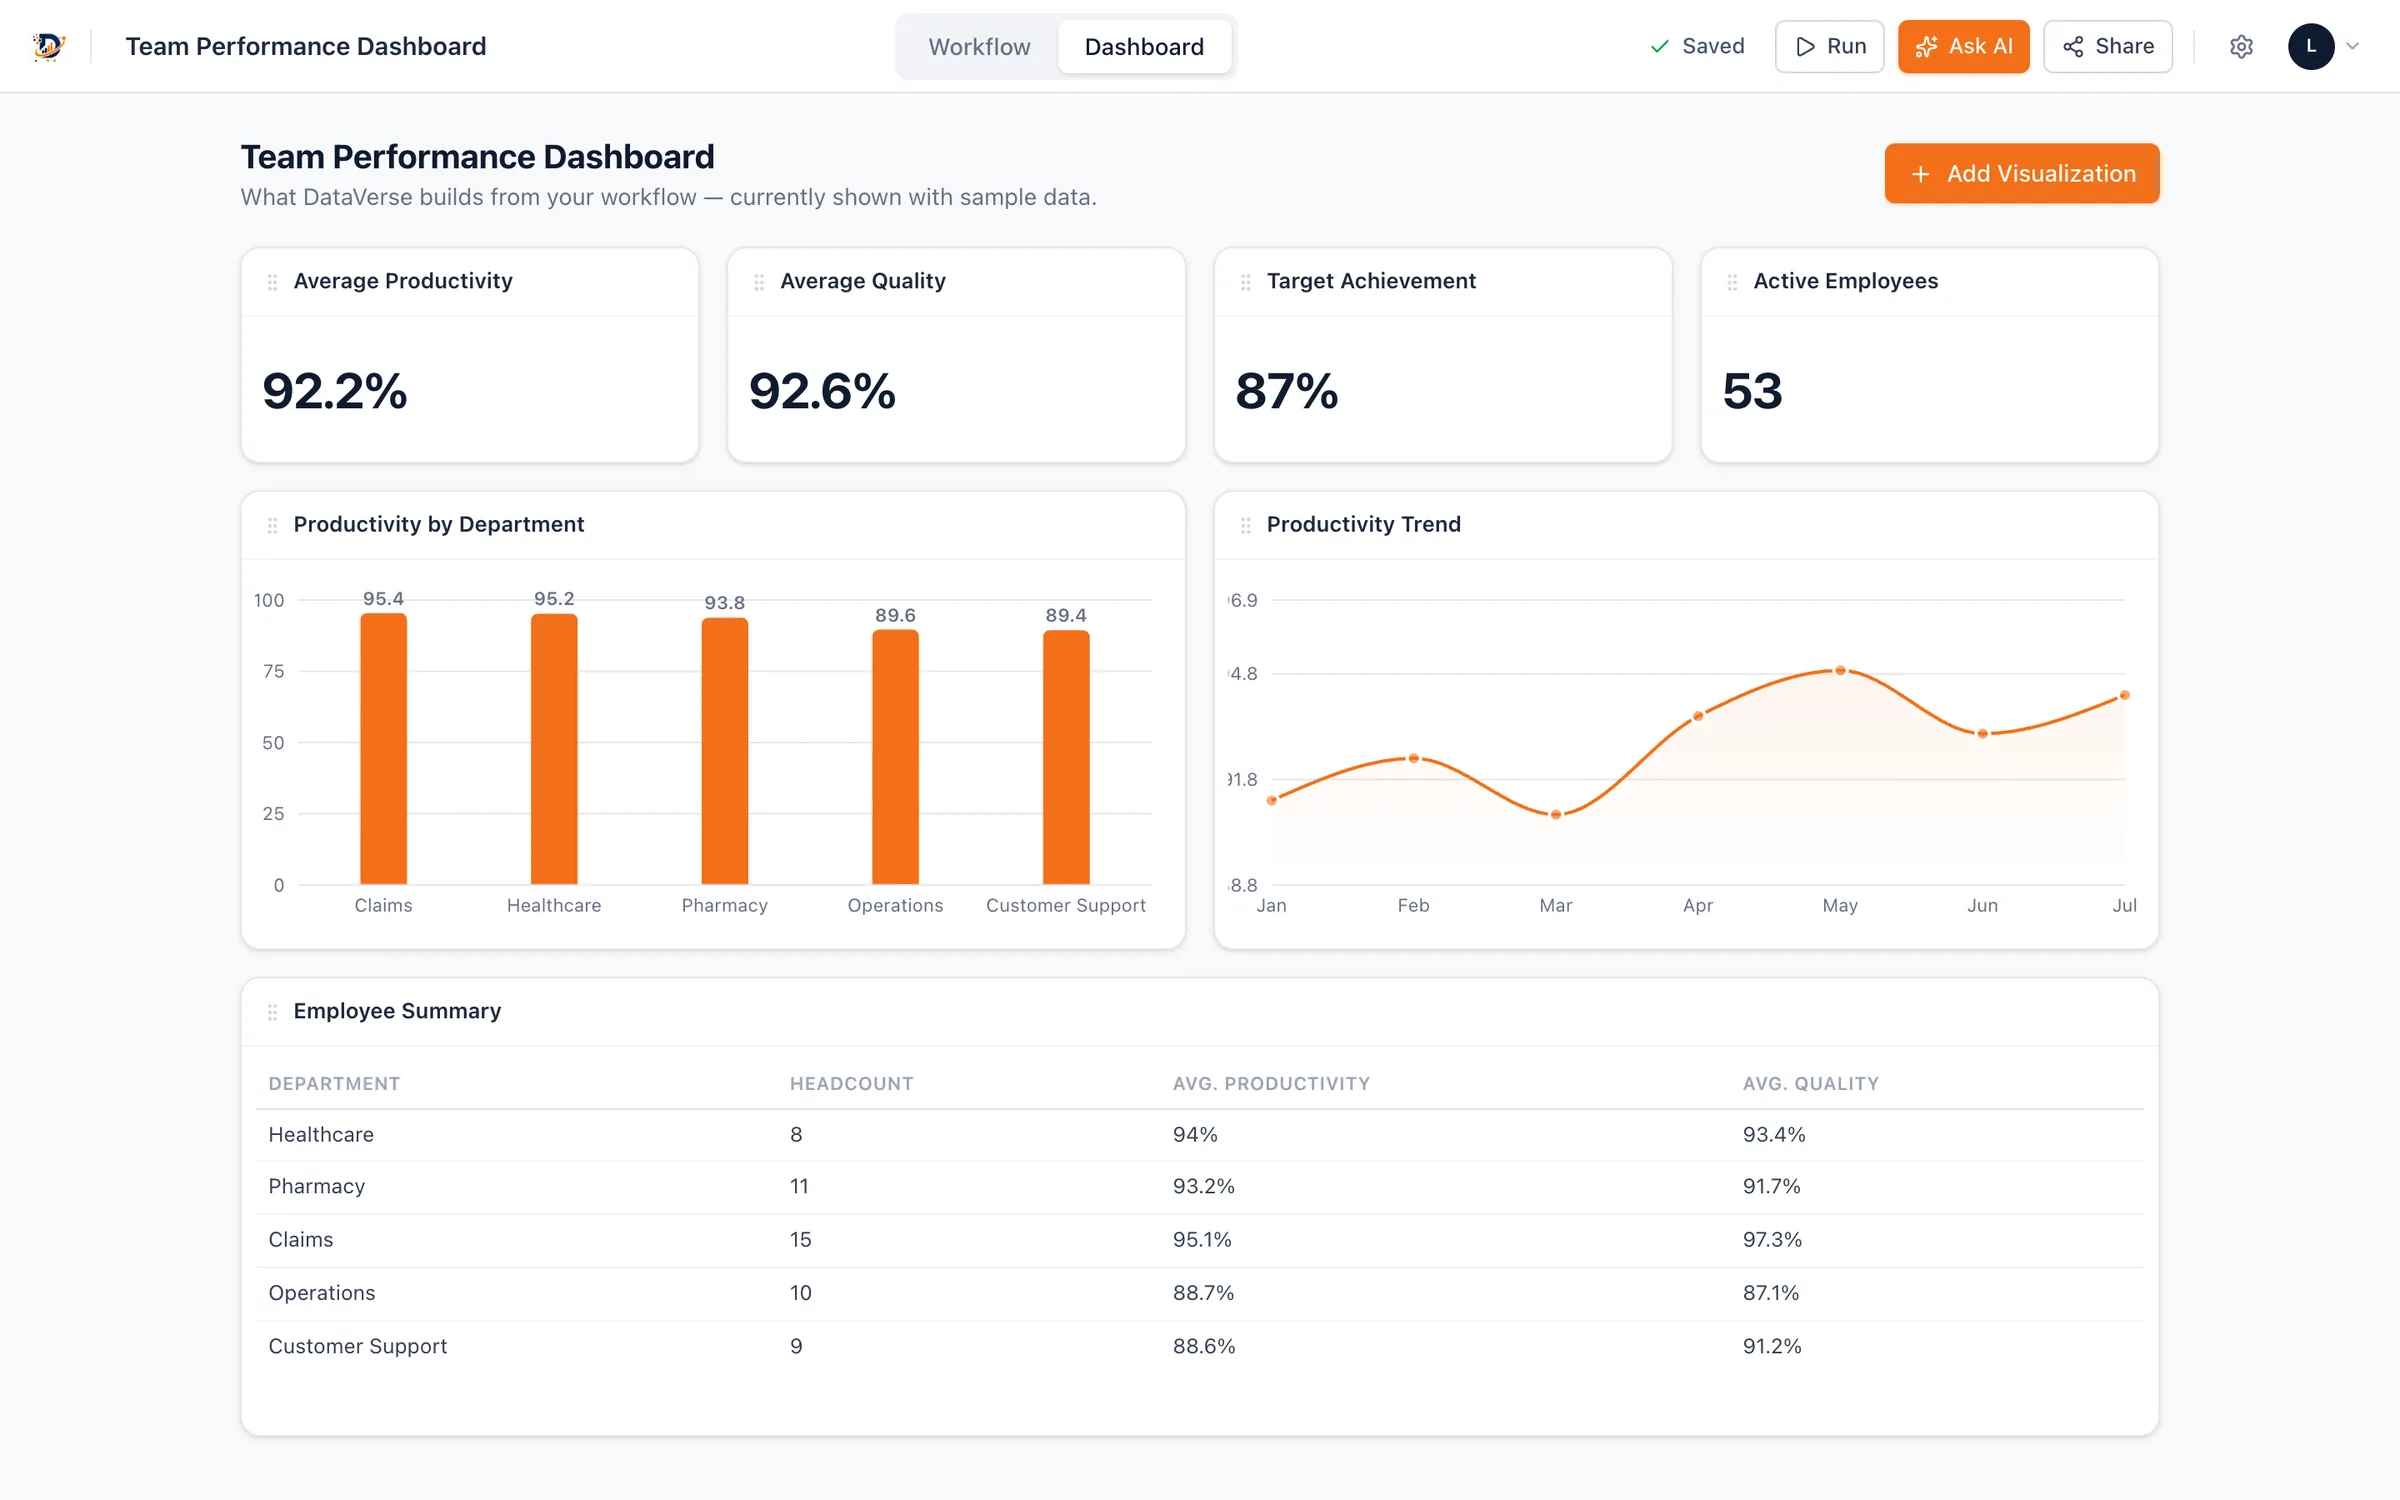
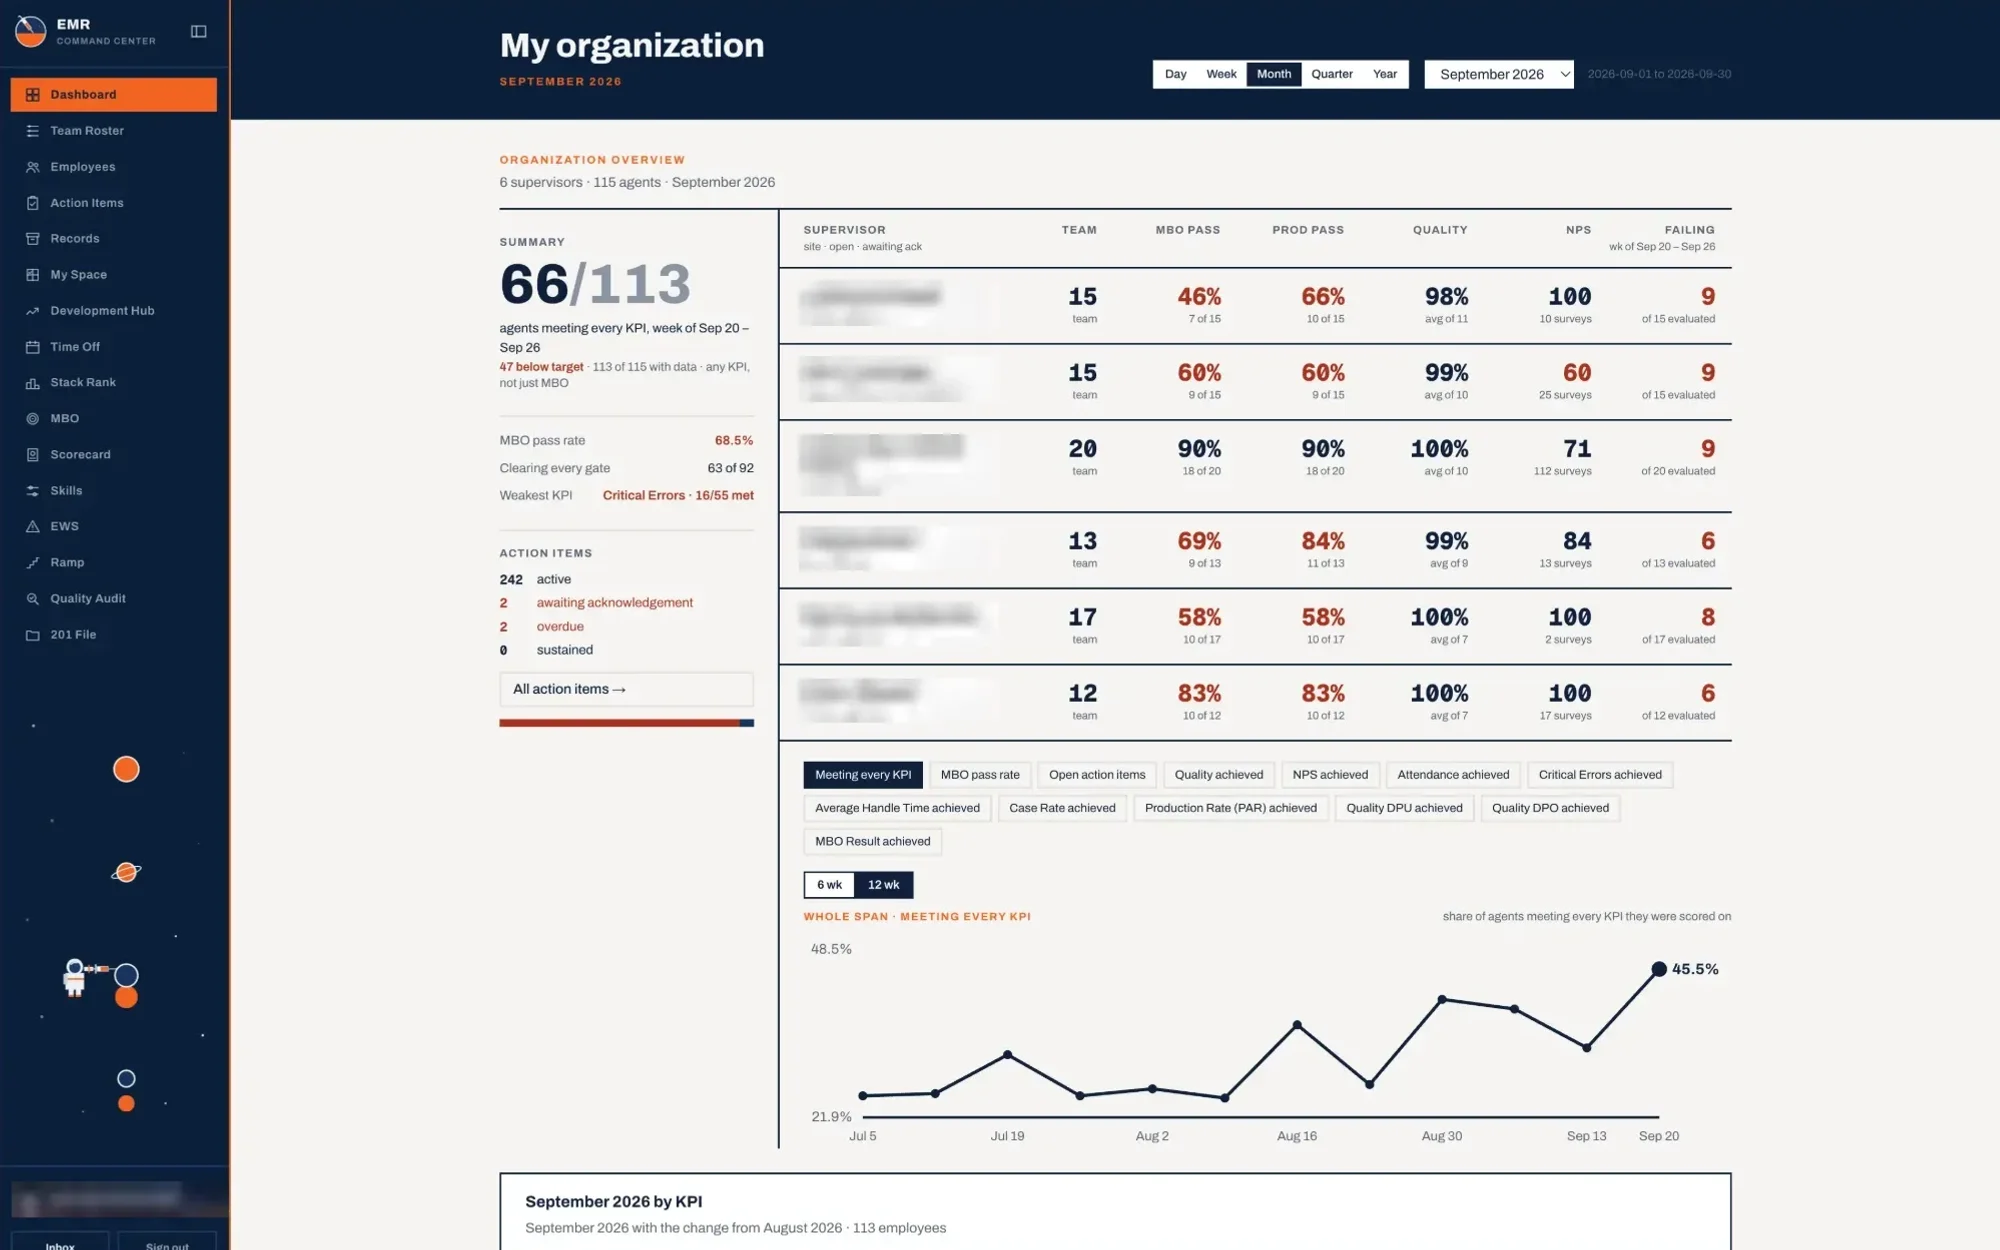
Dashboards
KPI tiles, bar, line, pie, and scatter charts, and tables from your results.
Gallery
Built With
- React
- TypeScript
- Vite
- Tailwind CSS
- React Flow
- Recharts
- Zustand
- Supabase

Start a Project
Have an idea?
Tell me what you’re thinking. Let’s turn it into something real.